
 Whether you are new to data management and modelling, or a seasoned pro, it is easy to get confused with the terminology and approaches when it comes to significance testing.
Significance testing is used to understand results of almost any quantitative activity. In marketing it is often used in research, customer relationship management (CRM) activities, marketing campaign testing and buyer behaviour or customer profiling.
This article tries to avoid the science and provide a marketing-related explanation of significance testing and its value.
Elements of a significance test
In order to run a significance test, firstly we need a result:
- In research this could be an outcome metric like “do you like X…”
- In CRM this could be an open/click rate or a response rate
Next, we need a couple of groups to run that test. These can be contrasting groups of people (for example males vs females) or groups matching predefined selection criteria. In either case we need to compare the two groups.
Lastly, we need to know how big these groups are.
Walking through the philosophy
A Direct Mail campaign is a great way to explain significance testing in a marketing context. Let’s imagine that you send 100 letters out to new customers and 10 respond to it. That means that you have a response rate of 10%.
Next month you re-do the exercise under the same conditions to a further set of 100 new people. Whilst you may expect 10% of people to respond, it would not be hugely surprising if 9 people responded or 11 did.
Now of course you don’t always nice rounded numbers to deal with. You may in fact have a campaign going to 101 new customers, but from that you wouldn’t expect to have exactly 10.1 people respond. So a little variance is often allowed.
The key question here is: how much variance should you allow? Or, when does the result become significantly different?
To answer this, let’s run a little theoretical test. Imagine we have a fair 10 sided dice, with a 1 (response) on one side and 0 (non-response) on all the others. Let’s say we rolled the dice 100 times, then recorded the response rate (i.e. 10 times 1 came up would be 10%), and we then repeated that test 16 times. We may have a result like this…
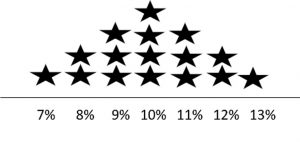
(Please note that this is just an example and not a real bell curve – it is just to help explain)
In this dice example:
- 4 of the tests come out with the target 10%,
- 10 of the tests are within 1 percentage point, and
- 14 out of the 16 tests (87.2%) are within 2 percentage points.
That is not the exact calculation in a significance test, however you do (hopefully) get the idea that if (in the Direct Mail example) you one day changed the message to your 100 new active customers and you got a 11% response rate, you probably would assume that there is no notable change. However, if you generated a 13-15% response rate you may think that is certainly a significant difference.
95% significance?
When people say “this result is significant” they usually mean it’s 95% significant, however you can set your significance to any level.
In the dice example we’ve used, remember there were 87.2% of cases having a result less than 13%. That is roughly what we are trying to say when we say something is (or is not significantly) different -“In 95% of cases this result is better/worse than the other result”.
That means that if you ran the controlled test 20 times, you would only expect a result that differed in one case.
What affects the significance?
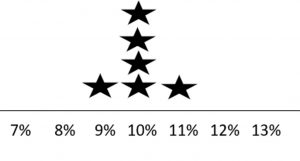
First off affecting significance is the sample size. For 100 records, 1 outcome can make a big impact – dropping a whole percentage point. When we look to a larger sample, say 1million, 1 case has less of an impact. If we had rerun our dice test with 1million tests, we should have got nearer to 10% more often. The results would look something like this…
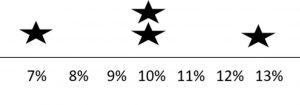
Another factor is how large the change we are looking at is. If we were expecting 10% and got 90%; that would be astounding. When we are looking at smaller changes though it becomes harder to detect….
Bringing it to life with marketing examples
A great resource you can use it to help your understanding and also in real life tests, is http://www.surveystar.com/ztest.htm,!
Let’s return to that Direct Mail campaign example. There we would have carefully structured a test to ensure that we are fairly testing a change in the creative approach of the campaign or its targeting method.
Let’s assume we are going to test two groups of 100 people, and our control has a 10% response rate. A 17% response rate for our test group is NOT 95% significant:
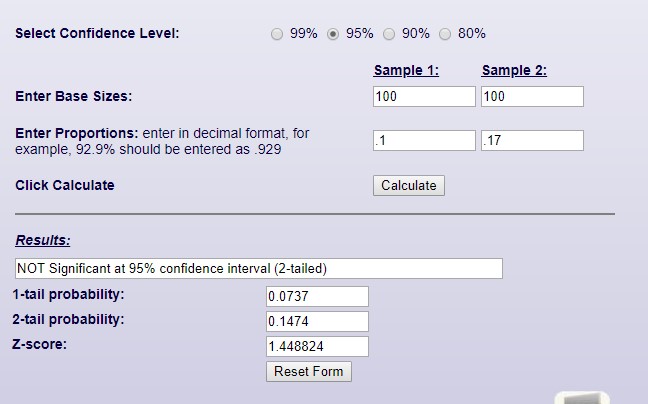
This means that whilst, we have achieved a 7% higher response rate to our control benchmark, we cannot be 95% confident we will get that every time.
We are however 80% confident…
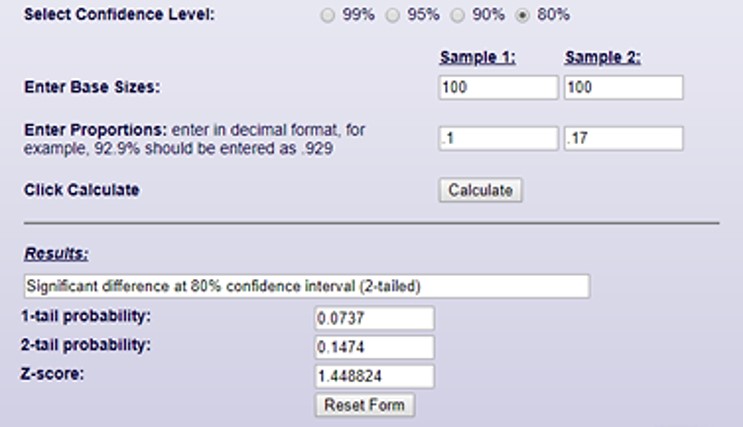
This means that there is a 1 in 5 chance the response generated is just a fluke. To get a 95% significance score, we would have needed a 20% response rate:
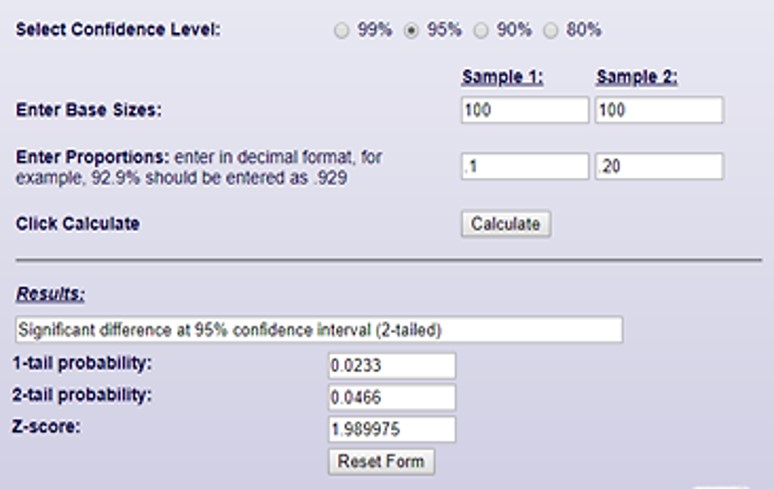
At 20% we can be confident that we would continually get a 95% response rate. Or, we could increase our sample size.
To demonstrate this, let’s now assume that our Direct Mail campaign was sent to 10k people in each group, but this time got a much narrow result of just 1% improvement…
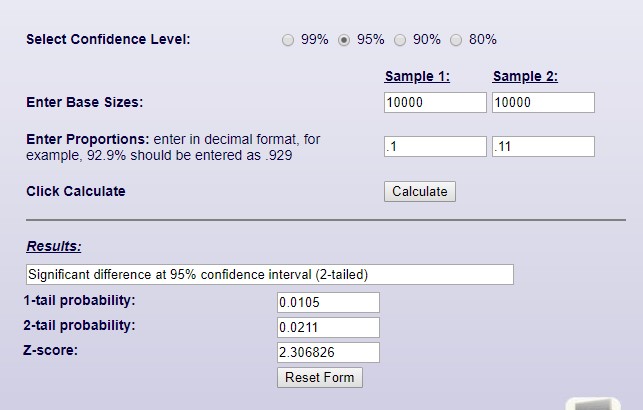
This final example shows a 1% improvement from 10% to 11% as 95% significant – and so repeatable. As we have a much larger sample size, we do not need to see such a significant swing in the results!
How else is significance used?
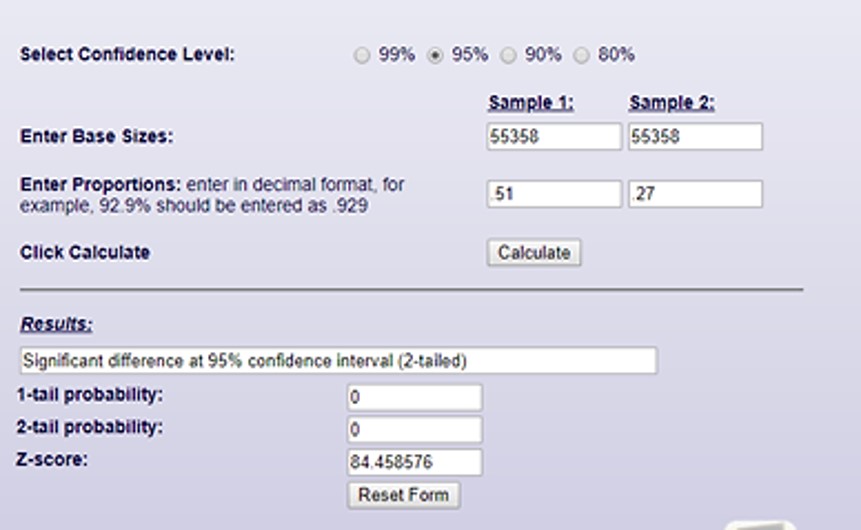
In our work at Fusion, we use significance testing in our profiling templates as part of our third party data modelling solution. In the example below, you’ll see we have a “target” and “base” profile for the match rate to the Electoral Role:

In our target file 51% of people’s data match to the electoral role, whilst only 27% of our base file does.
In this case we can calculate an uplift or index metric, to show the difference: 51/27(*100) ~192, which is significant
This is similar to the uplift of a 20% response rate vs a 10% response rate in the Direct Mail example above.
The index of which would be 200 (20/10*100).
We can input these results into our survey star test calculator, to double check:
Lessons to take away
Testing the significance of an outcome doesn’t need to be hugely complicated. It often comes down to thinking of how you’ll structure your test. When doing so, it is always good to think about and plan the test according to this order of considerations:
- The outcome: What is our base scenario is (i.e. we get 10% response)?
- The test: How are we comparing against our base scenario?
- The uplift: How different are the results?
- The sample size: What will determine how repeatable the outcome is?
Some further reading
There is a large amount of maths theory in significance testing, as it is the basis of more complex modelling and the validation of results. The examples we have shared are an attempt to translate its complex theory into simple marketing logic and practice.
Underneath are a layer of assumptions around how tests are structured. When we used the examples of our Direct Mail campaign results ranging between 7% & 13%, that is loosely based on the normal distribution. You can find out more about it here: https://revisionmaths.com/advanced-level-maths-revision/statistics/normal-distribution