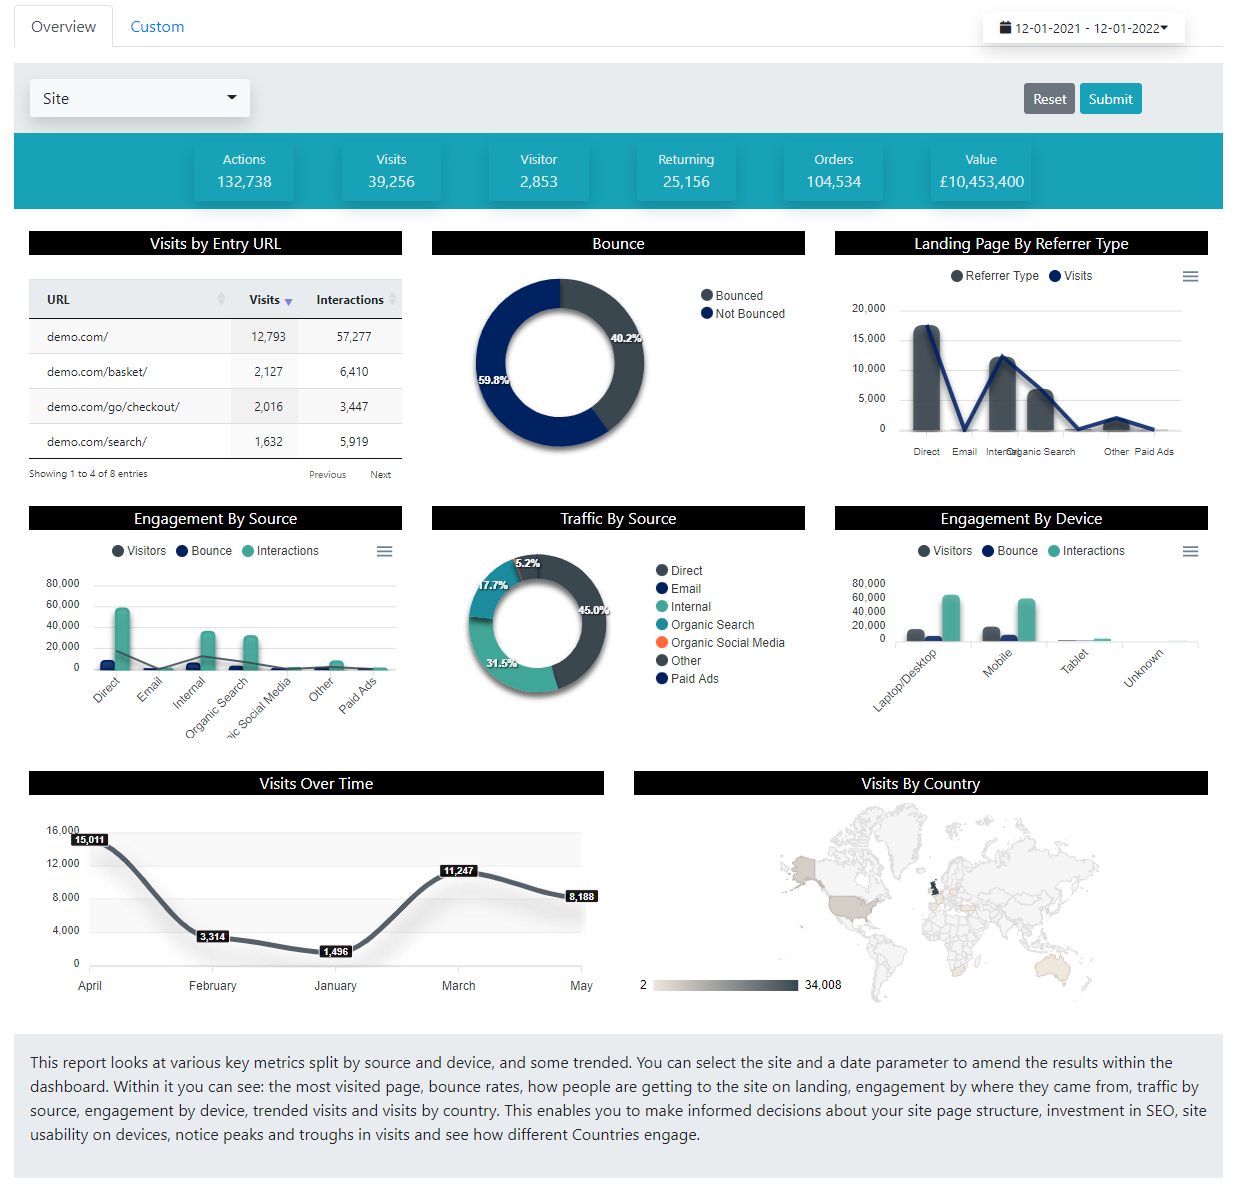
Customise your analytics reports for better insights and decision-making
WebFusion software from Fusion Analytics seamlessly integrates marketing and sales data data to give you clearer and more reliable analytics and business reports.
It can improve the quality and iron out problems with any multi-website reporting issues. In doing so it can help you better understand your marketing and sales performance in areas such as:
- Channel and source
- Customer profiles and segments
- Stages of the customer journey
- Speed of customer journey
- Conversion and aquisition points.

Robust tracking and reporting for a variety of metrics
Businesses use WebFusion to evaluate a wide range of their marketing and sales metrics. For example
- View tracking
- Event tracking
- Cross-domain tracking
- Email capture
- Cross-device stitching
- Social impressions capture
A user-friendly dashboard of your key metrics and KPIs
We understand how busy marketers and other decision-makers in a business are. That’s why WebFusion consolidates detailed tracking data into a user-friendly dashboard and suite of simple business reports. This greatly helps when it comes to quickly spotting trends or unusual occurences and speeding up decision-making.

A smooth integration with most standard reporting software
Rest assured, WebFusion integrates with most standard reporting software and campaign management systems via SQL. In doing so it brings together data from across your organisation and seamlessly integrates it into robust and reliable management information.
Here are some of the more popular software WebFusion integrates with

Businesses tell us WebFusion finally gives them the ability to combine and gain valuable insights from different:
- Offices in their various territories
- Channels in their marketing and sales mix
- Reporting systems across the organisation
- Silos of data in their processes
Common problems WebFusion resolves
As well as integrating data and analytics into user-friendly reports, WebFusion also corrects errors and improves the quality of data to enhance its robustness and reliability.
Common problems it resolves include:
- Harmonising data across multiple or too many platforms
- Tidying up tagging issues and old data
- Tackling inflexible reporting tools
- Correcting out of sync with other sources
- Improving previously limited access to granular data
- Establishing the ability to profile browsers
- Integrating and simplifyng analytical reports from multiple websites.
Remember, WebFusion can ntegrate with your current reporting tools so you can create your own views and reports.
Why not try it out?
Register here to get access to our example standard report. It will enable you to interrogate the data yourself.
Or email us at info@fusion-analytics.co.uk or call 0203 287 5387
Check out these case studies
Case study 1: Simplifying a complicated reporting system for a £2bn+ asset manager
The unique and complex nature of buying and selling, and subscriptions’ sign-ups was too much for this client’s incumbent analytics package.
The client had identified conflicting tags in their reporting, a duplication of page views, incomplete event tagging and poor data quality and outputs.

Our brief and solution
They came to us to tidy up their current data management system and improve the quality of their data and reporting. In particular they wanted to identify and track their complicated transaction customer types.
We reviewed the system and implemented a fresh set of tags. We also cleansed the data and tagged the entire customer journey. Going forward our dedicated data analyst helped the client to:
- Maintain the tags
- Interpret the reports for circulation
- Prepare a suite of reports: Monthly management and weekly detailed reports
- Present a detailed review of the customer journey for buying and selling
Case study 2: Helping a start up to be more savvy with its marketing spend
This young company came to us as its retargeting approach had meant they were struggling to identify their exact return on investment.
The same prospects were saturating their performance statistics, and our client needed to understand what was actually driving sales.
In their current system, they could not track individuals between the marketing and sales site and subsequently couldn’t determine which elements of their marketing were working… or not.

Our brief and solution
The client came to us in search of an overview of the website’s performance. In particular, they wanted to analyse the gross and net benefit of campaigns and see the full customer journey including all touch points.
Having reviewed their system we:
- Implemented a fresh set of tags to improve the tracking for the metrics they were keen to monitor
- Prepared a suite of reports which they could easily run to assess performance and identify trends on an ongoing basis
Our work enabled the client to identify the return on investment for their local marketing campaigns against national campaigns. Local was 5 times more effective, and as a result they reapportioned their marketing spend to gain greater results.
We were also able to show that there were between 1.5 and 4 visits to the site via search for every click in their email campaigns. Again, this helped them to produce more effective and successful campaigns going forward.
Interested to find out more?
Read our article about harmonising analytics reporting platforms

Request a call back from one of the team to find out how we can help

