
 This is a more technical article than our normal ones, however with recent reports that over 100k people in the UK may die of Coronavirus by the end of the year many of you may want to understand how the maths behind such forecasting models works.
The mathematical principles that we will discuss here in relation to the pandemic are commonly used in a wide range of applications. These include Marketing (i.e. modelling how word of mouth spreads “going viral”), Financial Services and Healthcare.
We will do our best to keep things simple, and have created an excel spreadsheet that you can also play with. It can be down loaded by clicking here.
Getting started
To start things off, let us look at how quickly things can spread. This really reviews the “R” or reproduction rate that we often hear about from the Government in relation to the virus.
If each person that gets the Coronavirus passes it on to 2 other people, the number of new cases would be shown as:
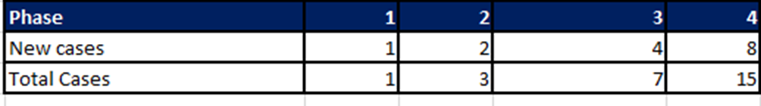
When the first person has passed the cases on to two others, there are then three cases in total. The two new cases then pass on to another two people each (i.e. four new cases), and the total becomes seven.
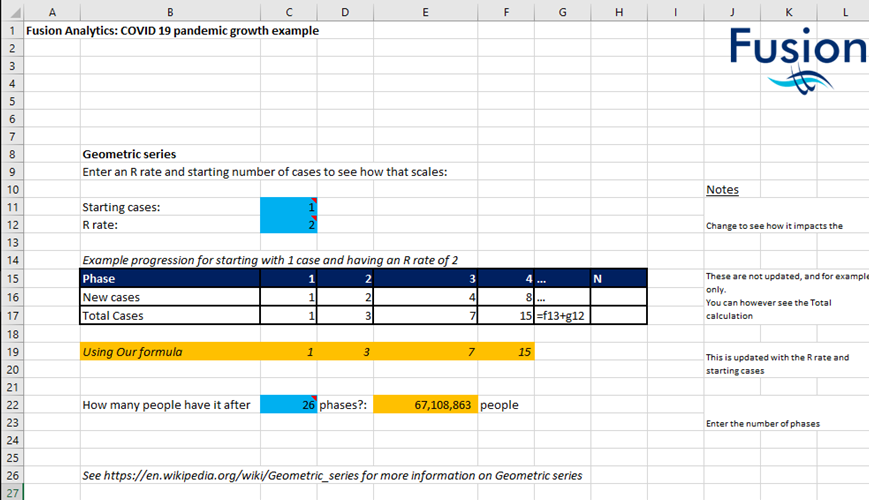
This growth is called a Geometric series ( for more detail see here ), and can be summarised with a formula. But don’t let this scare you, this formula has been entered into excel for you – click to download: Covid19 – pandemic modelling – 20200510
Using our excel tool (sheet “Geometric example” row 21) we can see that after 26 phases, the number reaches over 67m people – that would cover the whole of the UK! If each phase took 2 weeks, then it would take a year for everyone to get the disease.
Managing the pandemic
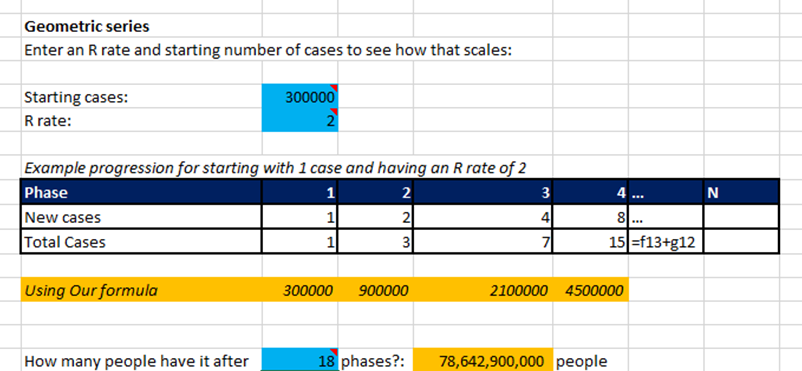
The models can be adjusted to represent where we currently stand, ie how many people have the cases today.
If we put in a starting number at 300k, we can see that we only need 18 phases to reach 78m people.
Understanding the R rate
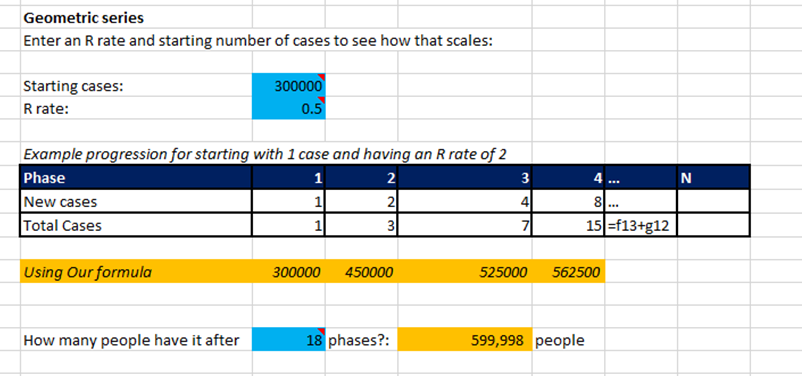
The R rate (or reproduction rate) is the main factor that is discussed in the news. If we adjust this to 0.5 we can see that after the 18 phases, the total number of cases/people is just 600k.
If you put in any number above 21, you will see that the total number of cases will stay limited to 600k. As we go through each phase the number of people that have it reduces and eventually it won’t get passed on any more.
It should be noted that the above model is a very basic model for illustration only.
In reality that R rate is variable. If everyone you know has the virus you cannot pass it on any further. Similarly when there are only a few cases (and given a person may be a carrier but not know they have it), they are more likely to spread it.
Given it is unlikely we could identify the last person with the case, they are likely to pass it to 2-3 people again and the pandemic comes back!
To overcome this (for modelling purposes) we can adjust our starting point and R rate, like we did between getting started and managing the pandemic sections, and then run multiple models (ie the R rate is 3 between 1 and 300k cases; then it can be reduced to 0.5 with social distancing or change to 2 without)
Calculating outcomes to plan resources
Using the COVID 19 Calculator tab in our excel sheet, we have entered some example outcome metrics and applied them to our base model. This type of approach can allow us to predict things like the number of additional hospital beds required:
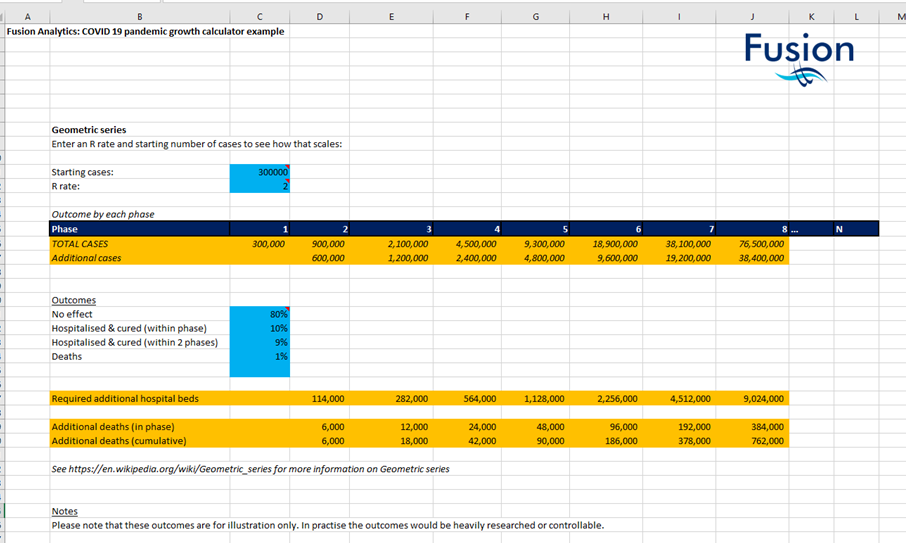
These numbers are fictional estimates. In practice we would need to get an estimate through research or experience. (ie for all new cases how many went to hospital and how many were discharged within 1 week vs 2 weeks).
In this case we have said that 10% of people that contract the virus are in hospital for 1 week and 9% for 2 weeks. We take the additional number of cases in each phase (and last weeks phase) and simply apply the percentages.
In this scenario (above – with 300k starting cases and R rate of 2) the whole population would have had the virus and there would be a need of up to 9m more beds in that last week.
With potential new drugs available allowing people to recover from the virus quicker we may be able to reduce the proportion of people requiring hospital beds, for example let’s adjust those requiring a bed from 10-7% and for two phases from 9% to 2%:
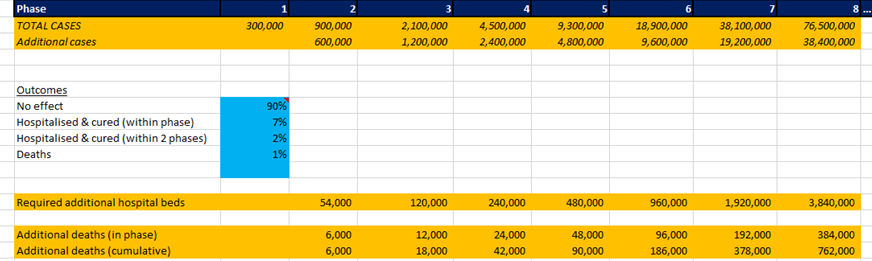
We can now reduce the number of beds required from 9m to 3.8m!
Including more assumptions and details
By modelling in phases between limits, and breaking down results like we have to estimate hospital usages, we can create more complicated models.
We may want to create a specific model for the highly at risk over 70s. To do this we would need research to estimate the starting number & R rates for this group. We could then overlay more specific experience out comes (such as increasing hospitalisation usage).
Then we could combine this with an Under 70s model to get the full picture. However, remember the more complicated a model we try to make, the harder it is to get accurate assumptions. It doesn’t mean a more reliable model.
Also remember that, as you reach certain limits – like say using up all of the beds, that will have repercussions too such as the mortality rate increasing.
Building a strategy to tackle COVID 19
Given a vaccine is not going to be ready for a year, the Government’s core strategy seems to have been:
- Reduce the R rate by social distancing and the lock-down
- Identify approaches to reduce time in hospital
- Significantly increase capacity of hospital beds for worst case scenarios
All seem fair points, and despite not requiring beds in the Nightingale Hospitals, we can see how they might have been needed (or may be needed in the future).
The main challenge we all will face is managing the R rate, as the lockdown starts to ease and new protocols come in place. Hopefully this article has guided how you can now create your own estimates and models for what that end game looks like.
About the Author
Fusion Analytics provides a wide range of analytical services to government bodies, financial services, marketing and logistics.
This article is not a guide it is only for educational purposes.
Please contact us for any questions on info@fusion-analytics.co.uk
Don’t forget to download the COVID19 calculator if you haven’t yet by clicking here