
Innovations Using External Data
We all have questions that we cannot currently answer with the information at hand: How well am I doing? How big is this market? What will happen if…? What is the best way forward?
For years we have put our trust in market researchers and econometricians to extrapolate small insights, facts and statistics, to try and answer these questions. After all they are the ones with the PHD’s.
However, is this all done needlessly? With the availability of data on each individual in the UK, do we still need to make these assumptions – can’t we start working with people rather than statistics?
This paper describes a sample of recent project done using UK wide individual data sets rather than smaller samples to support strategic and interesting projects.
Background
Businesses across the globe struggle with the unknown. Whilst there can be commonality between some businesses they will always have their own questions.
As Benjamin Franklin said: “An investment in knowledge pays the best interest”, so when undertaking a new initiative there is usually an abundance of suppliers that are available to give their opinion.
The common process to answer an unknown question is to use research to as the “what if” or “why questions”. However, these are normally always based on smaller samples of data. This leaves the questions; “is this representative”, “are there any skews in the sample”, or “how to I extrapolate this to represent the market view”.
With datasets containing hundreds or thousands of variables on each individual in the UK this article explains some use cases of external data to improve the accuracy of answers.
Our three cases
The three cases that we will discuss in this paper are referred to in our previous article about uses of external data:
| Business objective | The model | Application |
| Insurer wants to predict non-disclosure rate of their IFA’s | An individual level model to predict non-disclosure | Summarise IFA’s client by likelihood of non-disclosure |
| Energy provider wants to install smart energy meters | Predict those people that will or will not allow access to the property | Target postcode sectors with higher levels of predicted access |
| Answer ‘why’ someone responds to a mailing | Undertake market research to determine ‘why’, build model across the UK individuals | Use the UK to score and segment people, then apply an approach |
Given the nature of questions will change for each business, it is not expected that you will have the same question; hence why these are innovation case studies. To ask you own question please get in touch.
Insurer wants to predict non-disclosure rate of their IFAs
Life insurance used to be sold with mortgage policies, but regulations have loosened and it is now more flexible. IFA’s (Independent Financial Advisers) still tend to recommend taking life insurance (mortgage or not) if you have any dependants.
IFA’s have access to tools that find the best policies, not all policies are available online or at aggregator sites. However, all quotes are subject to you passing the underwriting process (U/W).
U/W for those who have not gone through it, is a gruelling questionnaire, often with over 100 questions. It goes into everything from finance, to health, activity and family history. At the end of the U/W questionnaire you will be given:
The policy at the advertised price
A rated policy, which is the advertised price * a multiple (1.1 to 3-4)
A referral, where you have to see a gp for a medical
A decline (i.e. they won’t give you a policy)
Now, if you are a bit over weight or have an obscure issue that is not always asked, IFA’S can guide you to insurers with lesser strict processes, or they may (in some cases) leave the information out altogether. This is process is called non-disclosure.
Non-disclosure is hard to prove, with an IFA it requires both parties to participate, which is thought to be uncommon. With over 37k IFA’s agents registered in the past 10 years it is impossible to check them all, so where to start?
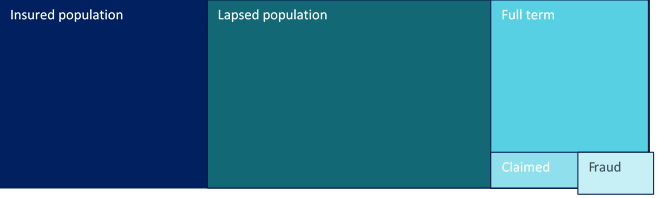
Essentially this is a mixture of customer life stage and outcome. We can assume that anyone who hasn’t disclosed their aliments will not lapse – as they are already on a cheap policy. Similarly, if they have gone full term, it is hard to prove they were unhealthy; and there is a limit to what we can do.
Therefore, we initially focus on the known cases of fraud (non-disclosed), claims, against the existing insured population. I.e. we want to find currently insured people who look like they could have not disclosed.
U/W data does provide a wealth of information. But in this case, we are looking for wrong or missing information. Therefore, we need to use external data to help explain the gap.
Example Record
| Name | U/W | External data | Non-disclosure probability | ||
| BMI | Activity | Has gym membership | Plays sport | ||
| Joe Blog’s | Low | High | No | No | High |
In our example above, we can see that Joe Blog’s has listed his BMI as low and that he is active. But we can see with external data that he is not a member of a gym and he does not play sport. Therefore, he has a high likelihood of non-disclosure.
What does this have to do with IFA’s?
Once we have this score we can then start to understand IFA’s at an individual level. Below is a hypothetical table ranking IFA’s by % of high probability of non-disclosure.
| IFA ref | Polices | % High ND probability |
| 34564 | 462 | 90% |
| 5362 | 756 | 89% |
| 54252 | 345 | 88% |
| 6467 | 53 | 79% |
| 15466 | 546 | 74% |
This gives a clear idea of potentially bad IFA’s that we can focus our investigation on. By using the individual level score, we can easily translate or findings into actionable information.
Energy provider wants to install smart energy meters
Many of us will have heard the adverts, specifically for gas and electricity, to try and get people to upgrade to a smart meter. This is a part of a government initiative to have smart meters in every home by 2020.
Some smart meters can be installed outside a property, whereas other require direct access inside the property. A big cost for energy companies is when somebody books an appointment, but then is not home at the agreed time. This happens fairly frequently as currently the installation is a free service.
Assuming a cost of say £100 of engineer’s time for each appointment missed, with up to 30% of people not making appointments and customer basis of up to 9m. The cost can run into the tens of millions.
Our energy company, for logistical and engineering reasons, had to rollout smart meters 1 borough at the time. So, with 40 boroughs in London they had c. 1 month per borough to install all the meters.
The agreed hypothesis was if we can target the boroughs most likely to allow access, then the momentum of smart meter installations will make it easier to “convert” the harder prospects. I.e. we wanted to target the prospects most likely to allow access and the installation.
With a distinct lack of data available other than name and address, we integrated an external dataset with over 1000 variables about each individual. We then built a model to explain who would not allow access and why:
The results showed that younger people with busy lives were less likely to allow access; unless they were highly affluent.
We could see the worst cases tended to revolve credit cards, an indicator that they were not financially savvy, they also found older people who were also likely to decline access were heavy gamblers.
Answer ‘why’ someone responds to a mailing
So, you have sent a campaign out to say 100k people and had a good set of 1k responders back. A good campaign. But you don’t want to send exactly the same creative to exactly the same people, so what do you do?
Let’s assume that we have also done market research on those people and identified that 50% of people were price driven and the other 50% were service quality driven.
Again, what do you do? If you over emphasise the low price to service orientated customers you may get less engagement and vice versa. The answer is that you need to have two separate creatives a value driven one and a quality driven one. But then you are left with the problem of how to decide who gets which creative…?
By using external data, we can compare the attributes of an offer driven person vs a quality driven person. With a wide variety of datasets available we could look at anything from the type and model of your car, how much you earn, where you go on holiday, or how much you spend in the supermarket.
The clever bit is to build the model and decisioning engine to assign each person to a creative.
About the Author – Howard Thompson
Working at the point where data meets statistics and technology. Howard supports businesses to overcome issues that were previously thought to be insurmountable. In his role as Data & Insight Director at Fusion Analytics he has focused on developing the ability to integrate multiple digital data sources with offline customer data to support a better understanding of how and why people buy.
Prior to his role at Fusion he has worked with a range of companies including; JD Williams, Cambridge Satchel Company, Subway, Waterstones, Swiss Re, Disney, Global Radio, SunLife and CapCo. If you are struggling to understand, use or apply findings from your data – Howard is the one to talk to.
If you would like to schedule a FREE consultation with Howard or one of our Analysts please get in touch HERE